|
|
Exam-Style Questions on Cumulative FrequencyProblems on Cumulative Frequency adapted from questions set in previous Mathematics exams. |
1. | GCSE Higher |
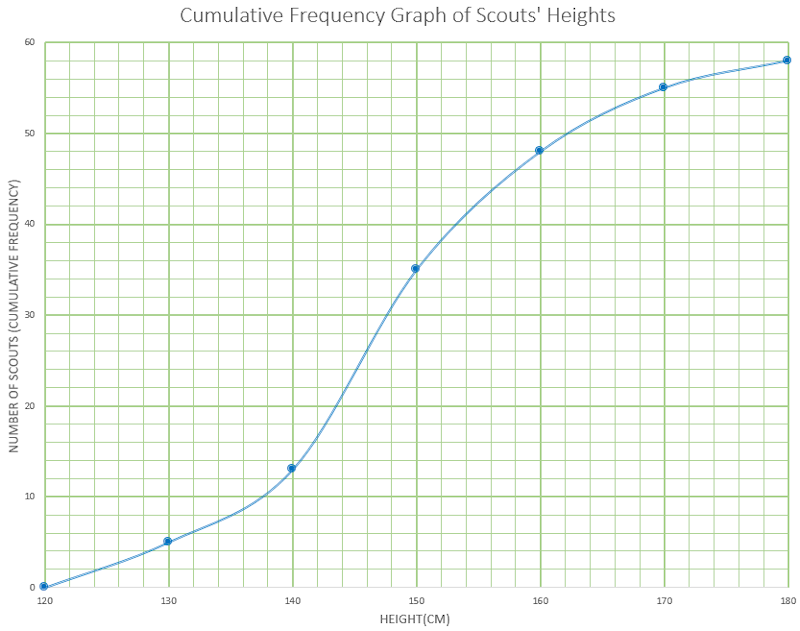
This Cumulative Frequency graph shows the heights of 58 Scouts. Work out an estimate for the number of these Scouts with a height greater than 160cm.
2. | GCSE Higher |
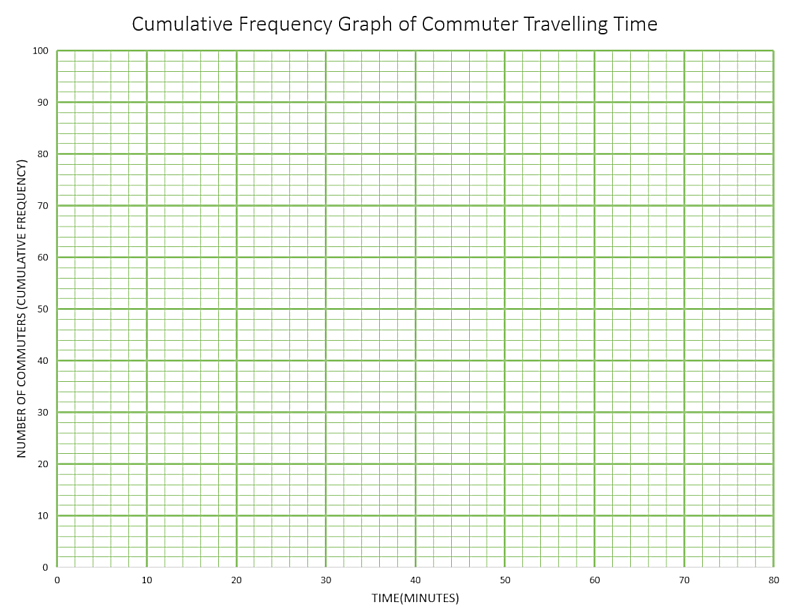
The grouped frequency table gives information about the times, in minutes, that 90 commuters take to get home from work.
| Time (t minutes) | Frequency |
|---|---|
| \(0 \lt t \le 10\) | 6 |
| \(10 \lt t \le 20\) | 32 |
| \(20 \lt t \le 30\) | 22 |
| \(30 \lt t \le 40\) | 10 |
| \(40 \lt t \le 50\) | 10 |
| \(50 \lt t \le 60\) | 7 |
| \(60 \lt t \le 70\) | 3 |
(a) Complete the cumulative frequency table.
| Time (t minutes) | Cumulative frequency |
|---|---|
| \(0 \lt t \le 10\) | |
| \(0 \lt t \le 20\) | |
| \(0 \lt t \le 30\) | |
| \(0 \lt t \le 40\) | |
| \(0 \lt t \le 50\) | |
| \(0 \lt t \le 60\) | |
| \(0 \lt t \le 70\) |
(b) On the grid, draw the cumulative frequency graph for this information.
(c) Use your graph to find an estimate for the percentage of these commuters who take more than 45 minutes to get home from work.
3. | GCSE Higher |
The distance walked by each of 68 hikers was recorded. The results are shown in the cumulative frequency curve.
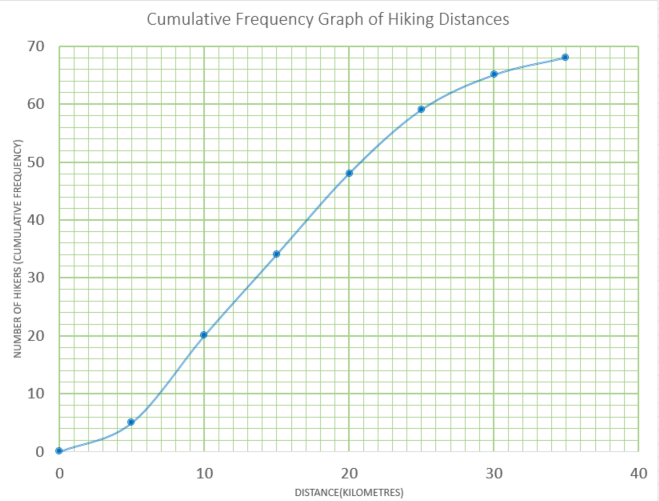
(a) Estimate the median.
(b) Estimate the interquartile range.
(c) Use the curve to complete the frequency table.
| Distance(\(d\) km) | 0 < d ≤ 5 | 5 < d ≤10 | 10 < d ≤ 15 | 15 < d ≤ 20 | 20 < d ≤ 25 | 25 < d ≤ 30 | 30 < d ≤ 35 |
|---|---|---|---|---|---|---|---|
| Frequency | 5 | 15 |
(d) Write down the modal class.
(e) Calculate an estimate for the mean.
4. | GCSE Higher |
The table shows the test marks for 31 students.
| Percentage (p) | Frequency |
| 5 ≤ p < 15 | 2 |
| 15 ≤ p < 25 | 3 |
| 25 ≤ p < 35 | 4 |
| 35 ≤ p < 45 | 3 |
| 45 ≤ p < 55 | 8 |
| 55 ≤ p < 65 | 8 |
| 65 ≤ p < 75 | 2 |
| 75 ≤ p < 85 | 1 |
Marco drew this cumulative frequency graph using the data.
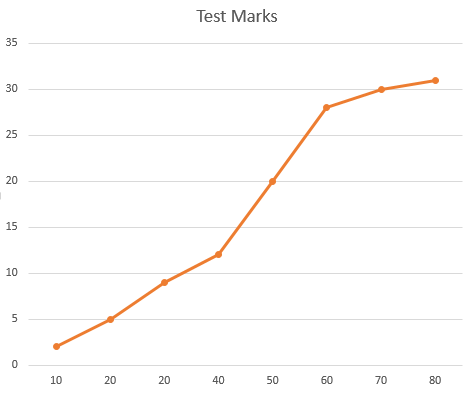
Make three criticisms of Marco’s graph.
5. | IB Standard |
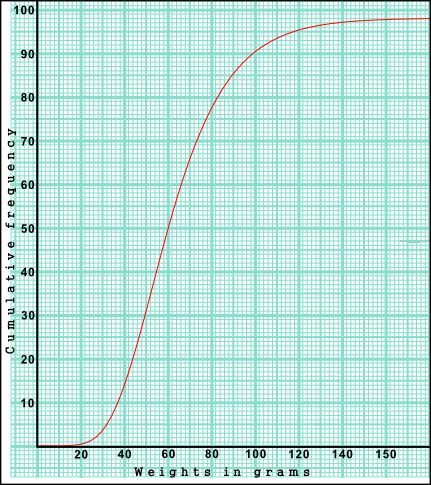
The weights in grams of 98 mice are shown in the cumulative frequency diagram. The heaviest mouse weighted 160g.
(a) Write down the median weight of the mice.
(b) Find the percentage of mice that weigh 70 grams or less.
The same data is presented in the following table.
| Weights w grams | 0 < w ≤ 40 | 40 < w ≤ 80 | 80 < w ≤ 120 | 120 < w ≤ 160 |
|---|---|---|---|---|
| Frequency | p | 63 | q | 3 |
(c) Find the value of p.
(d) Find the value of q.
(e) Use the values from the table to estimate the mean and standard deviation of the weights.
A second batch of mice are normally distributed with the same mean and standard deviation as those of the first group mentioned above.
(f) Find the percentage of the second batch of mice that weigh 70 grams or less.
(g) A sample of five mice is chosen at random from the second batch. Find the probability that at most three mice weigh 70 grams or less.
6. | IB Analysis and Approaches |
Gringe Hull Secondary School has students from Year 7 to Year 13. A group of 138 students in Year 9 were randomly selected and surveyed to find out how long it takes them to travel to school each morning. Their results are represented by the following cumulative frequency graph.
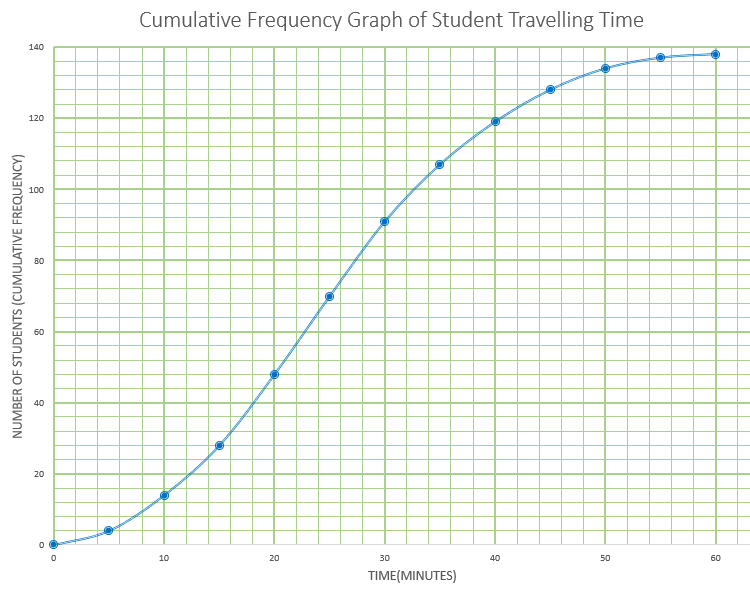
(a) Find the median number of minutes per day these Year 9 students spend travelling to school.
(b) Given that 20% of these Year 9 students spend more than \(k\) minutes per day travelling to school, find value of \(k\).
The same information is represented by the following table.
| Travelling time (m) in minutes | Frequency |
|---|---|
| 0 < m ≤ 5 | 4 |
| 5 < m ≤ 10 | 10 |
| 10 < m ≤ 15 | 14 |
| 15 < m ≤ 20 | \(p\) |
| 20 < m ≤ 25 | 22 |
| 25 < m ≤ 30 | 21 |
| 30 < m ≤ 35 | 16 |
| 35 < m ≤ 40 | \(q\) |
| 40 < m ≤ 45 | 9 |
| 45 < m ≤ 50 | 6 |
| 50 < m ≤ 55 | 3 |
| 55 < m ≤ 60 | 1 |
(c) Find the value of \(p\) and the value of \(q\).
There are 450 students in Year 9 at this school.
(d) Estimate the number of Year 9 students that spend less than 15 minutes travelling to school each day.
If you would like space on the right of the question to write out the solution try this Thinning Feature. It will collapse the text into the left half of your screen but large diagrams will remain unchanged.
The exam-style questions appearing on this site are based on those set in previous examinations (or sample assessment papers for future examinations) by the major examination boards. The wording, diagrams and figures used in these questions have been changed from the originals so that students can have fresh, relevant problem solving practice even if they have previously worked through the related exam paper.
The solutions to the questions on this website are only available to those who have a Transum Subscription.
Exam-Style Questions Main Page
To search the entire Transum website use the search box in the grey area below.